


Table of Contents
A Harvard Business Review study found that 89% of top-performing organizations attribute their success to the effective use of performance dashboards.
But when datasets grow, even the most advanced dashboards can struggle. Slow loading. Incomplete data. Delayed reports.
Dashboards power modern decision-making. Every second of lag means insights arrive late. And late insights cost opportunities, efficiency, and growth.
It doesn’t have to be this way. With the right architecture, caching, and loading strategies, even the largest datasets can feel instant.
Here are 10 best practices to help you get there!
1) Start with a Scalable Web Application Architecture
The foundation of any high-performing dashboard lies in its architecture. For organizations working with large datasets, scalability is non-negotiable. Dashboard performance is only as strong as the architecture it’s built on.
Partnering with the right Web App Development Services ensures that your dashboard is designed with scalability in mind from day one. A well-planned web application architecture for large datasets guarantees that as data volumes and user demands grow, performance remains consistent. Without it, dashboards can slow, features may fail, and costly re-engineering becomes inevitable.
A robust web application architecture for developing dashboards for large datasets should:
- Separate processing from presentation — Use a multi-tier architecture where data processing happens on dedicated backend services, and the front-end focuses solely on rendering the user interface.
- Support horizontal scaling — Design so that additional servers or instances can be added seamlessly to handle increased load without impacting uptime.
- Use efficient data pipelines — Implement ETL (Extract, Transform, Load) processes or streaming frameworks (e.g., Apache Kafka, AWS Kinesis) to process data continuously rather than in bulk.
- Leverage microservices and modular design — Break down the dashboard into independent services for data retrieval, authentication, analytics, and visualization, allowing them to scale individually as needed.
Investing in scalability from the start prevents technical bottlenecks, reduces long-term costs, and ensures your dashboard delivers timely insights regardless of data size.

2) Implement Intelligent Caching Strategies
When working with large datasets, every query to the database carries a performance cost. Without caching, your dashboard will repeatedly fetch the same data, wasting processing power and slowing response times.
Intelligent caching ensures that frequently accessed data is stored temporarily in memory, reducing load times and database strain. Here are some key considerations for effective caching:
- Use In-Memory Caching
Store high-demand data in memory to bypass repetitive database calls. Tools like Redis or Memcached can deliver responses in microseconds.
- Define Expiry Rules
Set Time-to-Live (TTL) values so cached data automatically refreshes at the right interval, ensuring speed without sacrificing accuracy.
- Selective Caching
Cache only what makes sense: historical reports, reference lists, or data that doesn’t change minute-by-minute. This keeps storage efficient and relevant.
- Client-Side Caching
For static assets — like chart images, filter lists, or UI components — store them locally in the browser so they load instantly for repeat visits.
When done right, caching can improve dashboard speed dramatically, allowing decision-makers to access critical insights without waiting on heavy queries or large data transfers.
3) Optimize API Architecture for Seamless Data Flow
APIs are the lifeline of any data dashboard. They connect your dashboard’s front-end with the back-end systems, databases, and third-party data sources. But when APIs are slow, overloaded, or poorly designed, every interaction — from applying a filter to switching a chart — feels sluggish.
An optimized API architecture ensures that data flows like water through a well-designed pipeline — quick, clean, and reliable.
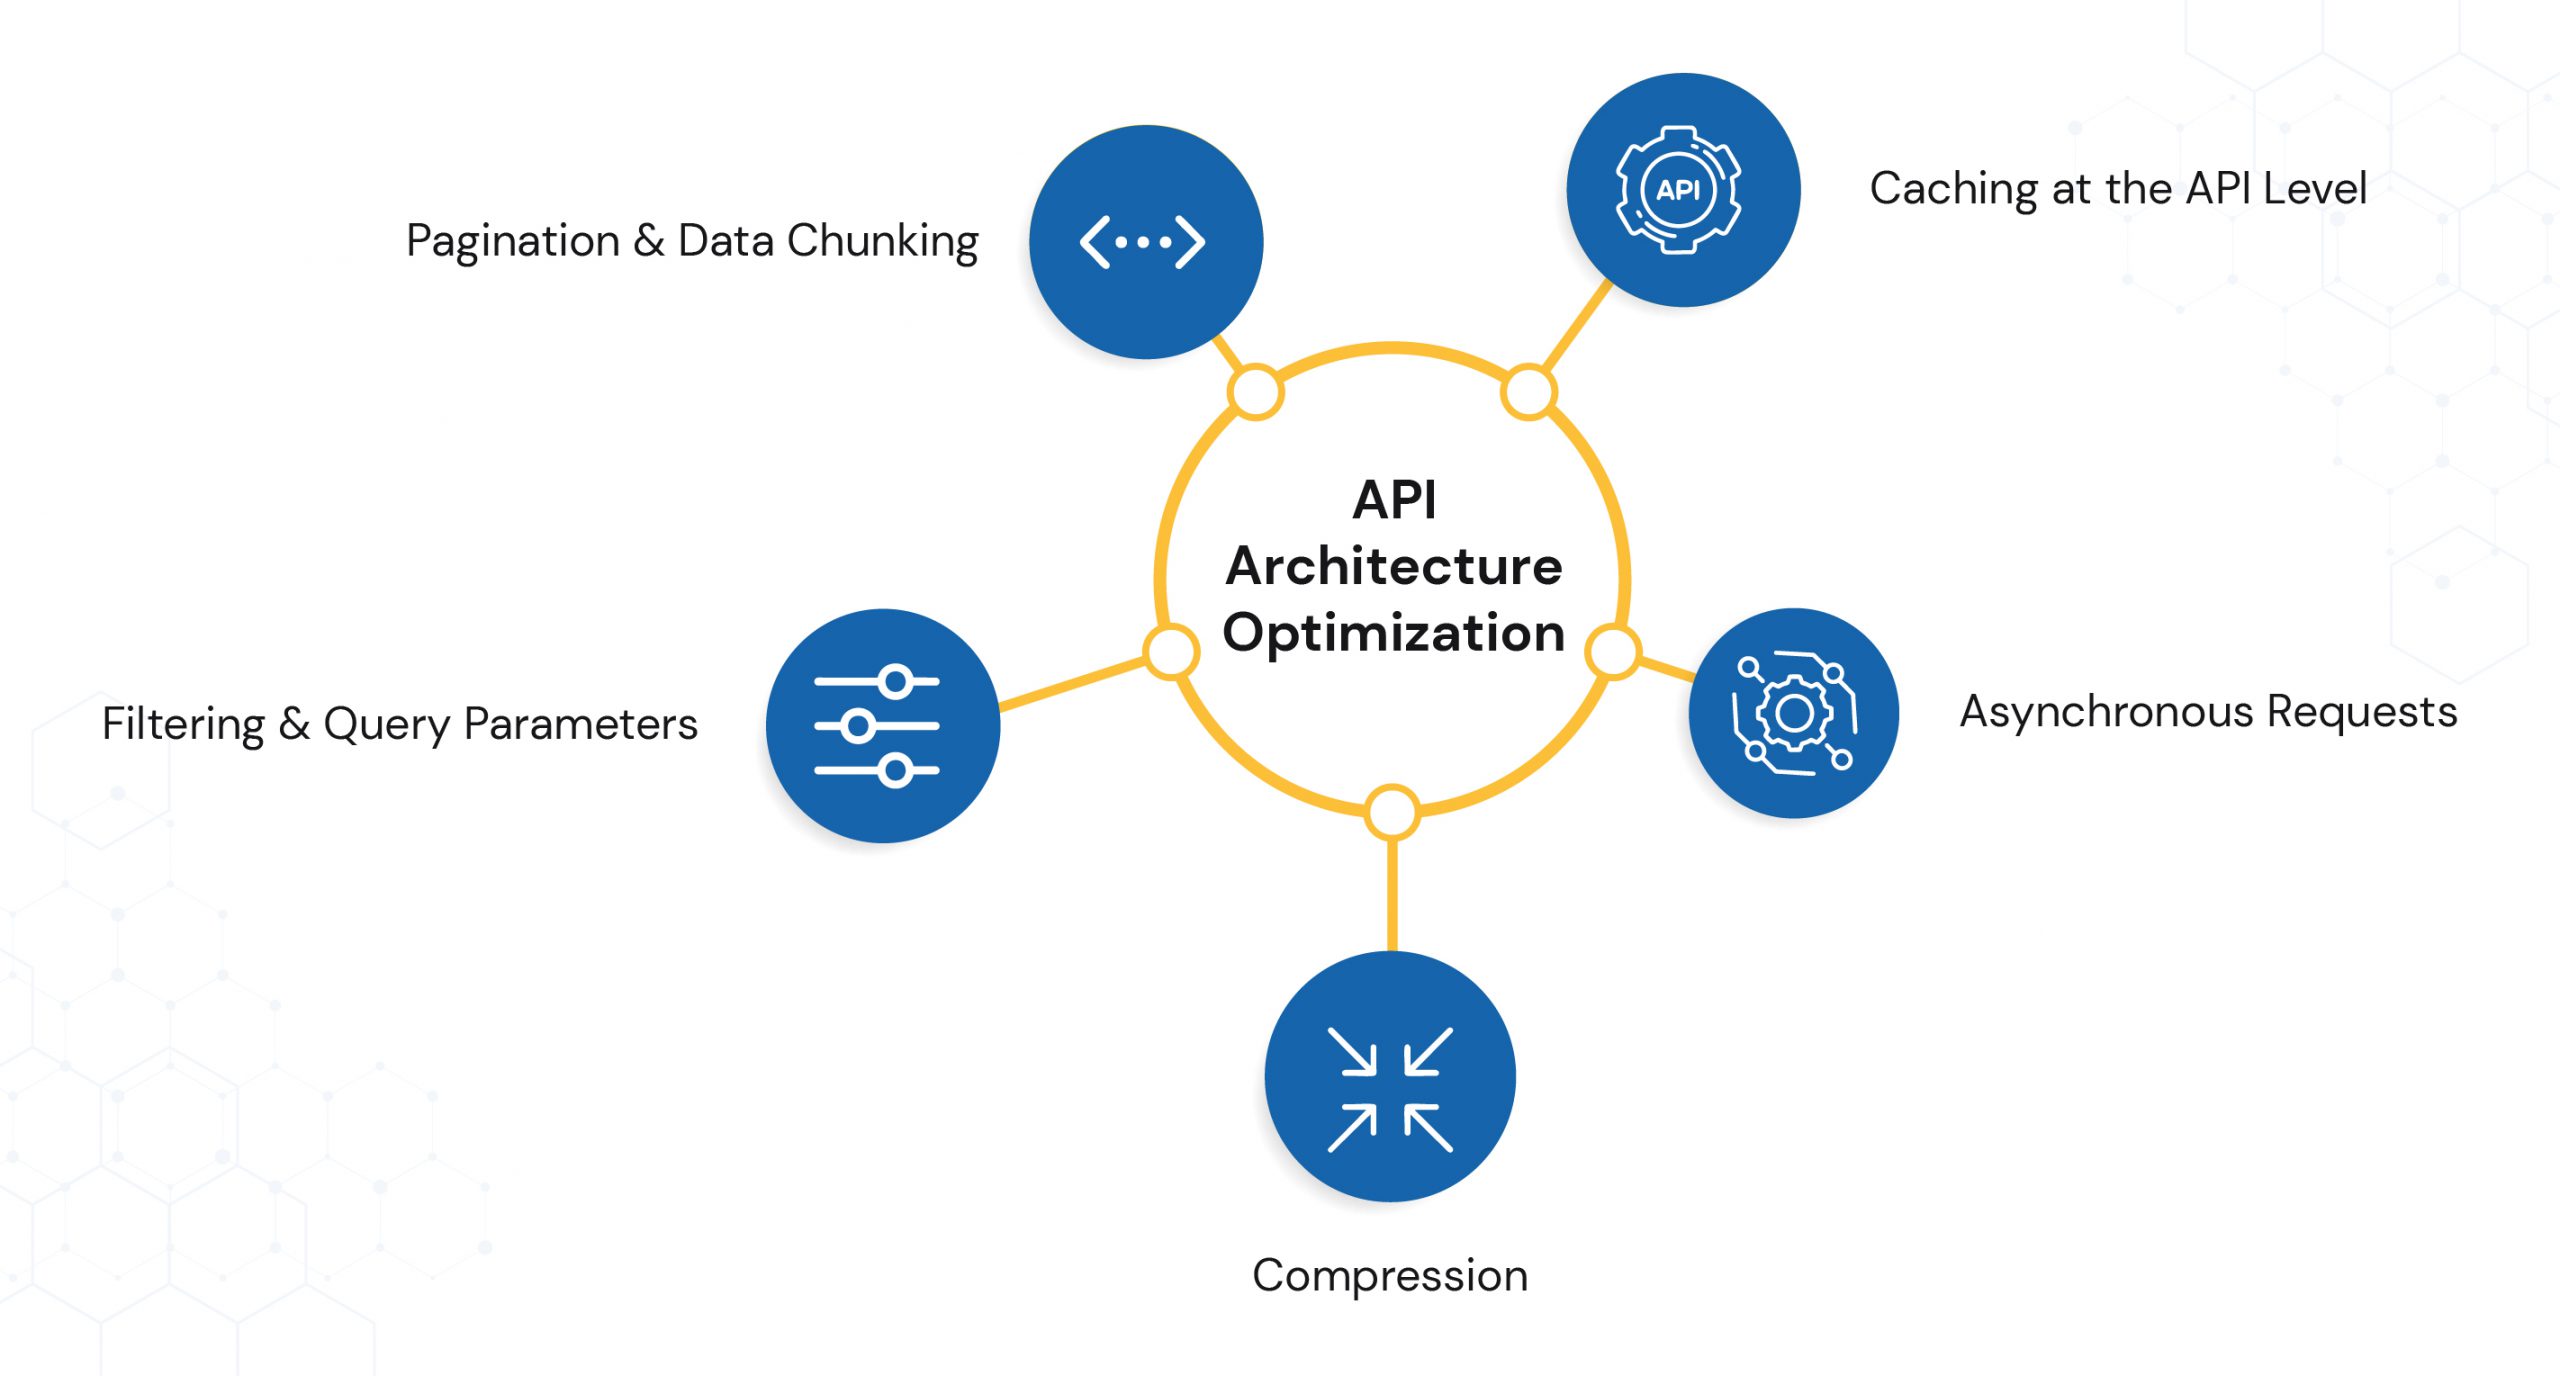
Here are the best ways for API Optimization:
- Pagination & Data Chunking – Instead of sending thousands of records in one go, break data into smaller, manageable chunks. This reduces payload size and speeds up initial load.
- Filtering & Query Parameters – Give APIs the ability to fetch only what’s needed — e.g., specific date ranges, regions, or metrics — instead of retrieving the entire dataset every time.
- Compression – Use formats like Gzip or Brotli to compress data before sending. Smaller data = faster transfer.
- Asynchronous Requests – Let parts of the dashboard load independently so users can start interacting while other components fetch their data.
- Caching at the API Level – Store common API responses temporarily so repeat requests can be served instantly without hitting the database.
4) Build for Scalability, Not Just Today’s Needs
Dashboards often start small — a handful of charts, a few filters, maybe one or two data sources. But as your business grows, so does the complexity: more KPIs, more users, more real-time integrations. If the architecture isn’t built to scale from day one, performance will hit a wall when traffic spikes or data volume multiplies.
Asynchronous data loading solves this challenge by allowing critical elements of the dashboard to appear first while secondary data loads in the background. This ensures that users can start interacting with the dashboard immediately, without waiting for every single data point to be processed.

How Asynchronous Data Loading Works (Technically)
Prioritize API Calls:
- The dashboard first triggers APIs for essential KPIs or summary metrics.
- Additional queries for detailed tables, drill-downs, or historical trends are queued to load later.
- Client-Side Rendering with Async Functions:
- JavaScript’s async/await or Promise-based functions handle multiple parallel requests without blocking the main UI thread.
- The user sees partial results immediately, while the rest continues to load invisibly in the background.
Lazy Loading & Pagination:
- Components such as charts and tables load only when the user scrolls to them or requests more rows.
- Prevents the dashboard from rendering unnecessary data upfront.
Streaming Data Updates:
- Real-time dashboards can use WebSockets or Server-Sent Events (SSE) to stream incoming data progressively instead of fetching full datasets repeatedly.
Caching for Performance:
- Frequently accessed queries are cached at the API or CDN layer to avoid redundant fetches.
- Incremental updates refresh only the changed data, not the entire dataset.
Main Benefits that comes with Asynchronous Data Loading
- Speed: Initial view loads in seconds, not minutes.
- Usability: Teams can start analysis without waiting for all queries to complete.
- Scalability: Handles growing datasets without degrading performance.
- System Efficiency: Reduces server stress and network load.
5) Use Data Preprocessing and Aggregation to Reduce Load Times
Raw datasets are rarely optimized for immediate use in dashboards. They often contain redundant rows, unnecessary fields, or granular transaction-level data that, while useful in some contexts, can significantly slow down rendering times when processed on demand.
By preprocessing and aggregating data before it reaches the dashboard, you shift the heavy lifting away from the user’s browser and into a more controlled, optimized environment — such as a data warehouse, ETL pipeline, or pre-computed cache.
How This Technically Works:
ETL (Extract, Transform, Load) Pipelines
- Extract: Data is pulled from source systems (databases, APIs, IoT feeds, CRM, ERP).
- Transform: Unnecessary columns are dropped, data is cleaned, and numeric fields are pre-calculated into meaningful KPIs.
- Load: Optimized datasets are stored in a data warehouse or cache-ready storage for instant retrieval.
Pre-Aggregated Tables
- It is more loke instead of fetching 10 million sales transactions for real-time summing, create a daily or hourly sales summary table.
- Tools like Materialized Views (PostgreSQL, Snowflake, BigQuery) can refresh automatically at set intervals.
Indexing & Partitioning
- Database indexes are created on frequently queried fields (e.g., date, region_id, product_id) to speed lookups.
- Partitioning large tables ensures queries scan only relevant segments, reducing execution time.
Columnar Storage Formats
- Using Parquet or ORC instead of row-based storage reduces read times significantly for analytical workloads.
Server-Side Aggregation APIs
- The backend processes aggregation queries and sends only ready-to-use datasets to the frontend, eliminating the need for client-side computation.
Main Benefits it Bring for Your Business
- Faster Dashboard Load Times — Users receive already-prepared data, minimizing processing on the browser.
- Reduced Query Costs — Especially in pay-per-query cloud warehouses like BigQuery or Athena.
- Better Scalability — Handles increasing data volumes without user-facing slowdowns.
- Consistent KPI Accuracy — Pre-aggregation ensures everyone sees the same computed values.
6) Implement Caching for Frequently Accessed Data
When your business dashboard repeatedly queries the same datasets — such as monthly sales summaries, inventory levels, or customer engagement metrics — fetching the data from the original source every time can be unnecessarily resource-intensive.
Caching addresses this challenge by storing frequently accessed data in a fast-access memory layer (in-memory cache) or a persistent intermediate storage layer, so dashboards can retrieve results instantly without re-executing complex queries or API calls.
How Caching Works in Business Dashboards
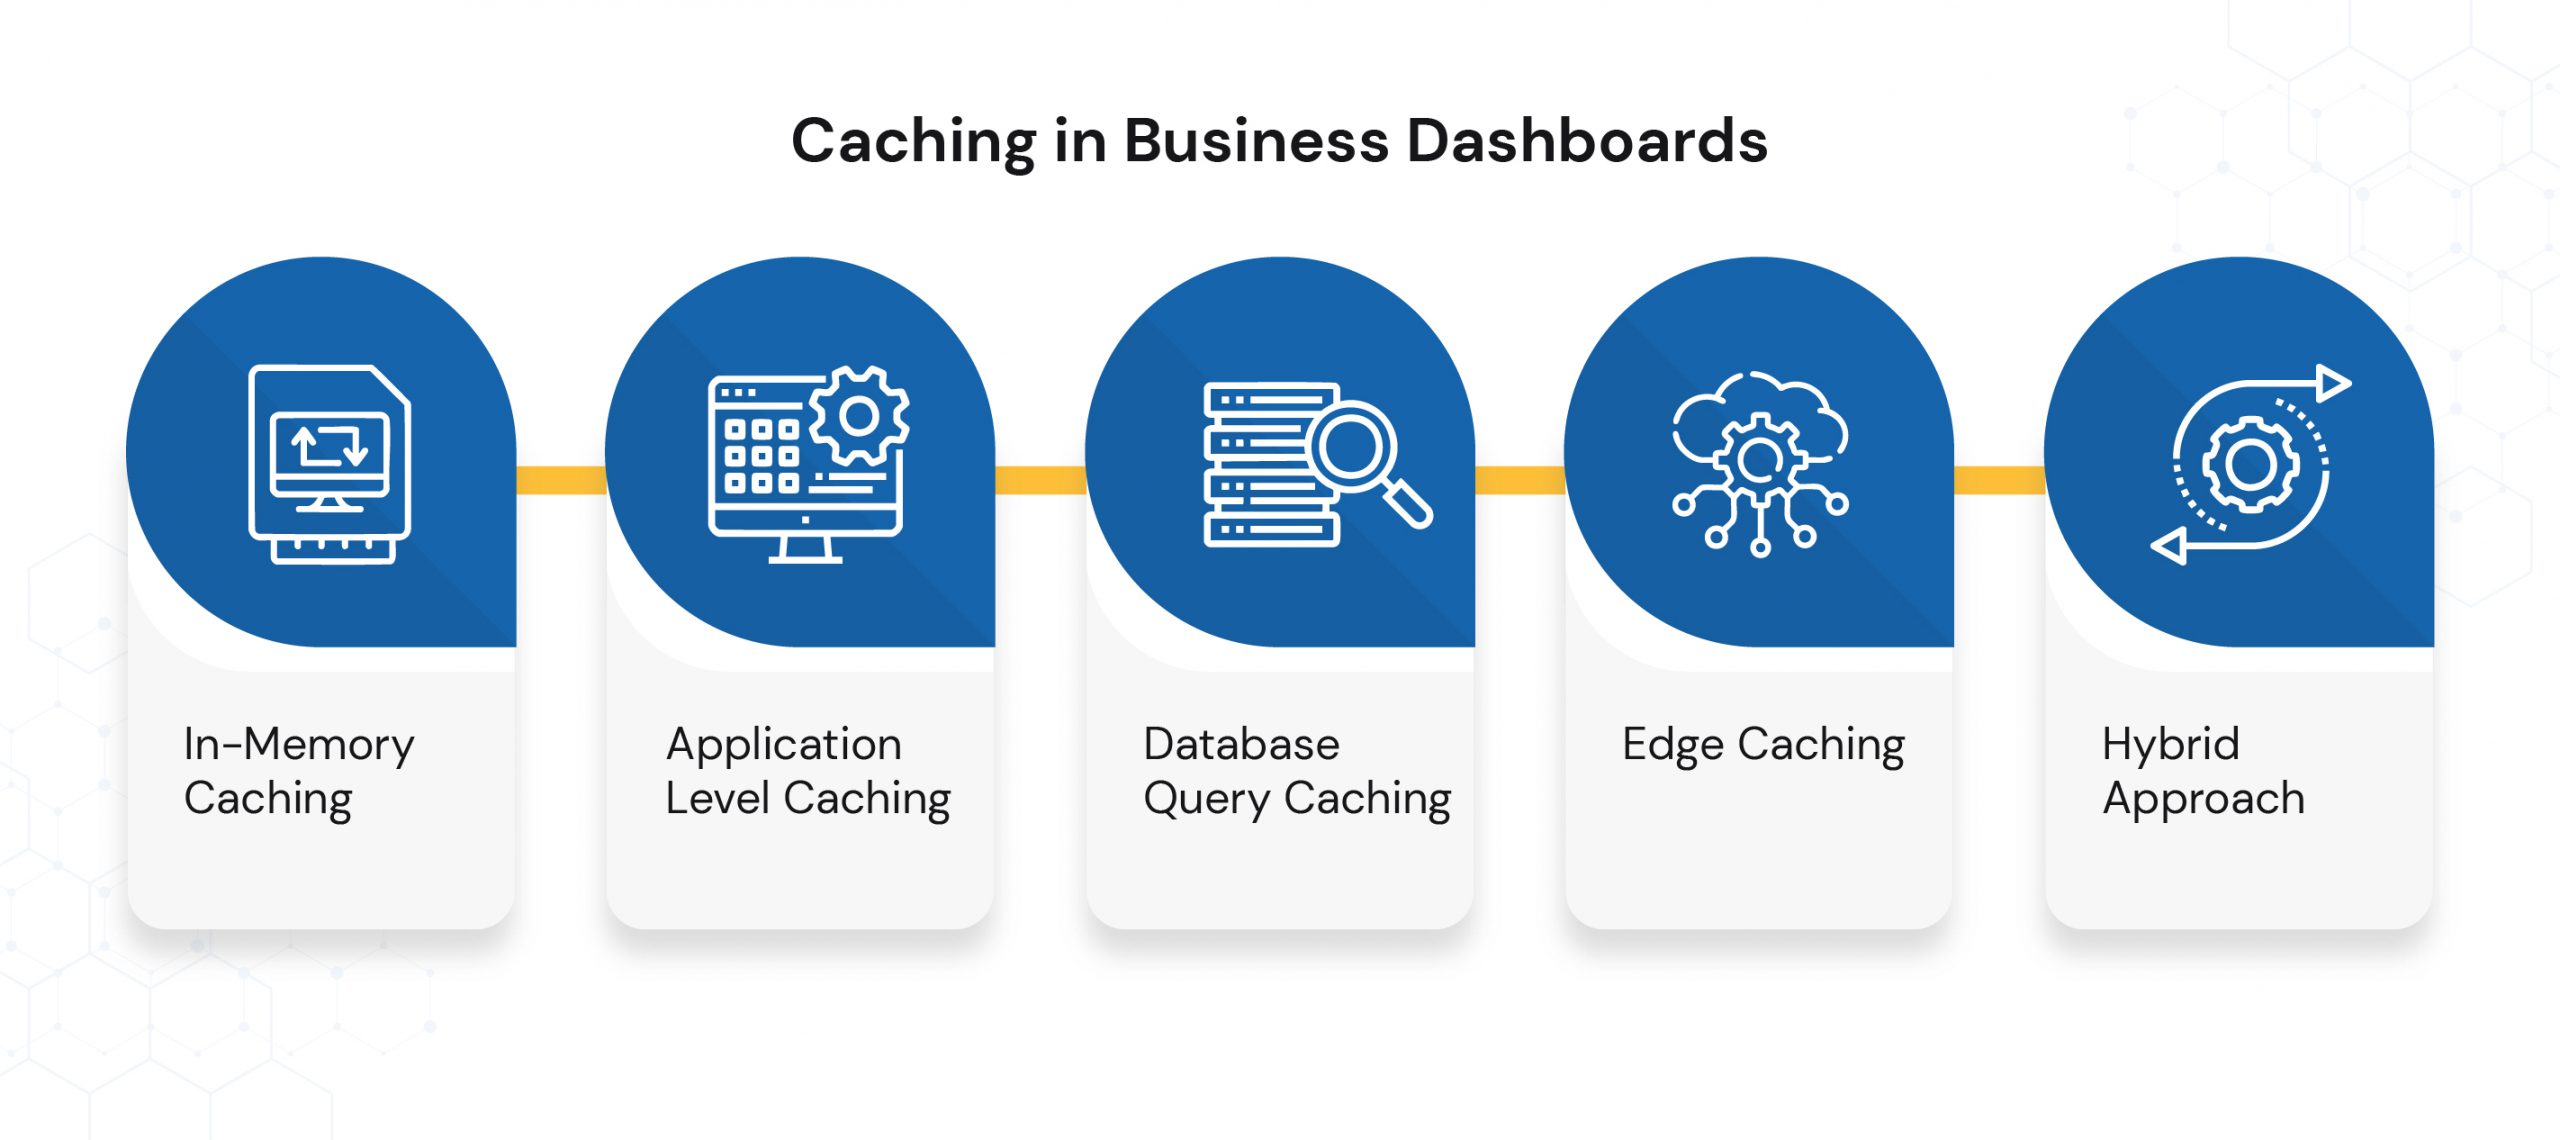
In-Memory Caching
- Tools like Redis or Memcached store computed results in RAM for ultra-fast retrieval.
- Perfect for real-time dashboards displaying KPIs that refresh every few seconds.
Application-Level Caching
- Web frameworks (e.g., Django, Spring Boot, Laravel) maintain cached query results for the duration of a user session or predefined TTL (time-to-live).
Database Query Caching
- Relational databases such as MySQL, PostgreSQL, and SQL Server can cache query execution plans or results, improving dashboard performance.
Edge Caching
- Using CDNs (e.g., Cloudflare, Akamai) to cache static datasets at the network edge, reducing latency for globally distributed teams.
Hybrid Approach
- Combining pre-aggregation with caching ensures both lightweight data payloads and instant access speeds.
The Business Benefits of Caching in Dashboards
- Significantly Reduced Load Times — Caching can bring query response times down from seconds to milliseconds.
- Lower Infrastructure Costs — Fewer direct database hits reduce cloud compute expenses.
- Improved User Experience — Smooth, lag-free dashboards enhance adoption among business teams.
- Scalable for High Traffic — Handles spikes in user requests without impacting performance.
7) Prioritize Data Security and Access Control
When dashboards deal with large datasets, speed and usability often take center stage. But for decision-makers, data security is just as critical, especially when those dashboards display sensitive financial, operational, or customer information.
A single security lapse in your dashboard can lead to:
- Breach of confidential business data.
- Non-compliance with industry regulations like GDPR, HIPAA, or SOC 2.
- Loss of stakeholder trust and potential legal action.
Best Practices for Securing Dashboards:
Role-Based Access Control (RBAC)
- Assign permissions based on job responsibilities.
- Limit visibility of sensitive datasets only to authorized users.
Data Encryption in Transit and at Rest
- Use TLS/SSL for secure data transfer between the database, server, and dashboard.
- Implement AES-256 encryption for stored datasets to prevent unauthorized data access.
Audit Trails & Monitoring
- Keep logs of who accessed what data and when.
- Use automated alerts for suspicious activity patterns.
Secure API Integrations
- Always use API keys, OAuth tokens, and HTTPS connections for external data sources.
- Rotate keys regularly to reduce the risk of exposure.
Compliance-Driven Design
- Align dashboard data handling with regulatory requirements relevant to your industry.
- Include data anonymization where required (e.g., masking customer names or IDs).

Building Scalable Web Applications What Enterprise CTOs Should Prioritize
Send download link to:
8) Progressive Data Loading and Infinite Scroll
When working with large datasets, loading everything at once is like trying to drink from a firehose — overwhelming for both the user and the system. Progressive data loading, combined with techniques like infinite scrolling or “Load More” pagination, ensures dashboards deliver data as needed without compromising speed or user experience.
Additional Benefits of Progressive Data Loading
- Improved Data Freshness – Since data is fetched in smaller, on-demand batches, each request can pull the latest values from the server, keeping dashboards more up-to-date.
- Prioritized Data Delivery – Enables loading of high-priority or “above-the-fold” content first, so critical KPIs and metrics are visible without delay.
- Better Mobile & Low-Bandwidth Performance – Reduces the strain on slower networks and ensures dashboards remain usable even on mobile connections.
- Adaptive Data Experience – Allows the system to adjust the volume of data fetched based on device type, user role, or current network speed.
- Scalable Backend Load Management – Distributes server queries over time rather than hitting the backend with massive data requests in one go.
- Seamless User Interaction – Prevents disruptive “full page reloads” when fetching additional data, maintaining user flow.
The Right Way to Do Progressive Data Loading
- Implement server-side pagination or lazy loading APIs that return only the requested slice of data.
- Use Intersection Observer API in the frontend to detect when the user is near the end of the list and trigger background data fetches.
- Combine with caching strategies so that previously loaded data is instantly accessible when scrolling back.
- Optimize API calls with cursor-based pagination over offset-based for better performance with large, dynamic datasets.
- Integrate loading placeholders (skeleton screens) to keep the interface visually stable and assure users that data is loading.
Wrapping Up
A high-performance dashboard built for large datasets strengthens decision-making, boosts operational efficiency, and builds trust in your organization’s data systems.
In short:
- The architecture is your foundation.
- Caching and preprocessing are your accelerators.
- Security and scalability are your safeguards.
Your next step: Audit your current dashboard against these best practices, identify your weakest link, and fix it first. Connect with us to make your dashboards that merge performance, usability, and scalability to focus on insights, not delays.